
AWS Datazone
A data management service that simplifies data sharing and governance across organizations, enabling teams to catalog, discover, share, and govern data stored across AWS, on-premises, and third-party sources.
WHAT is the problem?
Fragmented data across AWS services causes slow, inefficient data management.
WHY is this important?
The problem leads to poor data quality, wasted time, and inefficient processes.
HOW does our solution address this?
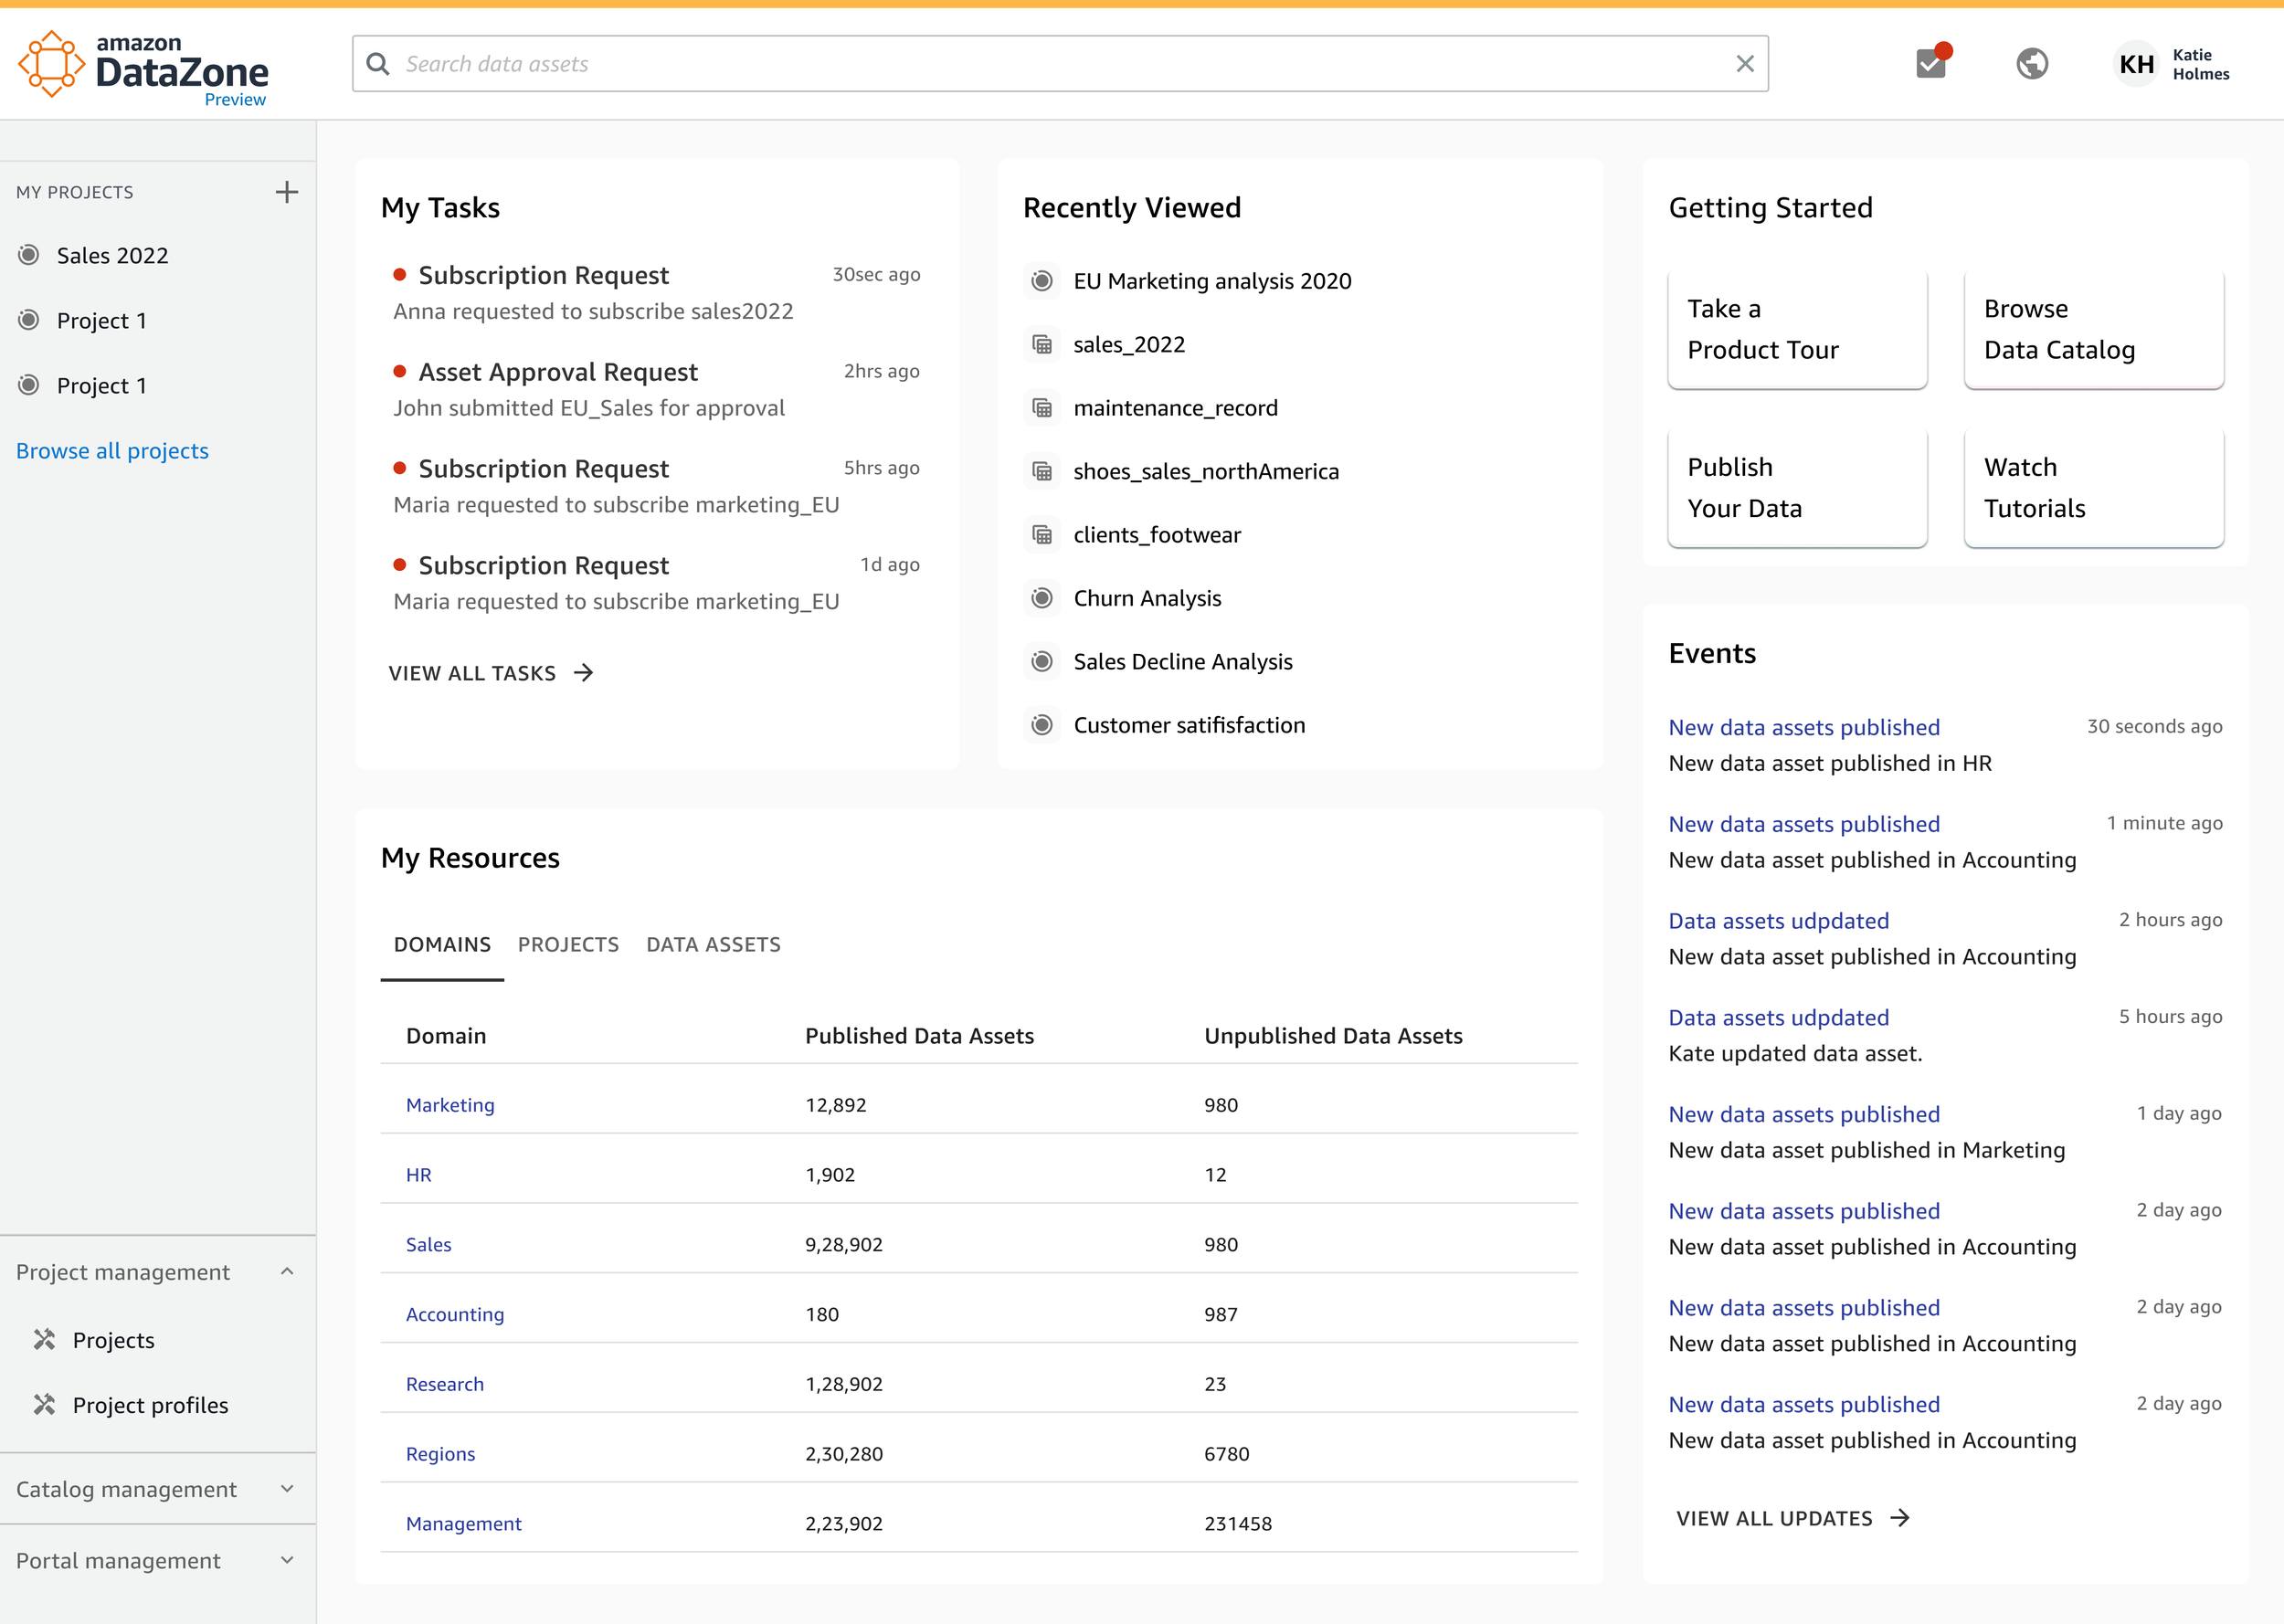
A unified business data catalog brings together disparate data.
WHO are our users?
All AWS users, including both data consumers and producers.
My Role & Contribution
I led the design for Data Discovery, Data Assets & Metadata Templates
Researched and defined user requirements.
Aligned cross-functional teams on catalog features.
Validated product requirements through user testing.
Developed scalable design system.
Facilitated design implementation & UAT.
Collaborators / Stakeholders
PM
Engineers
(Backend, Frontend, API )Datazone Leadership
UX designers
My Key Deliverables
-
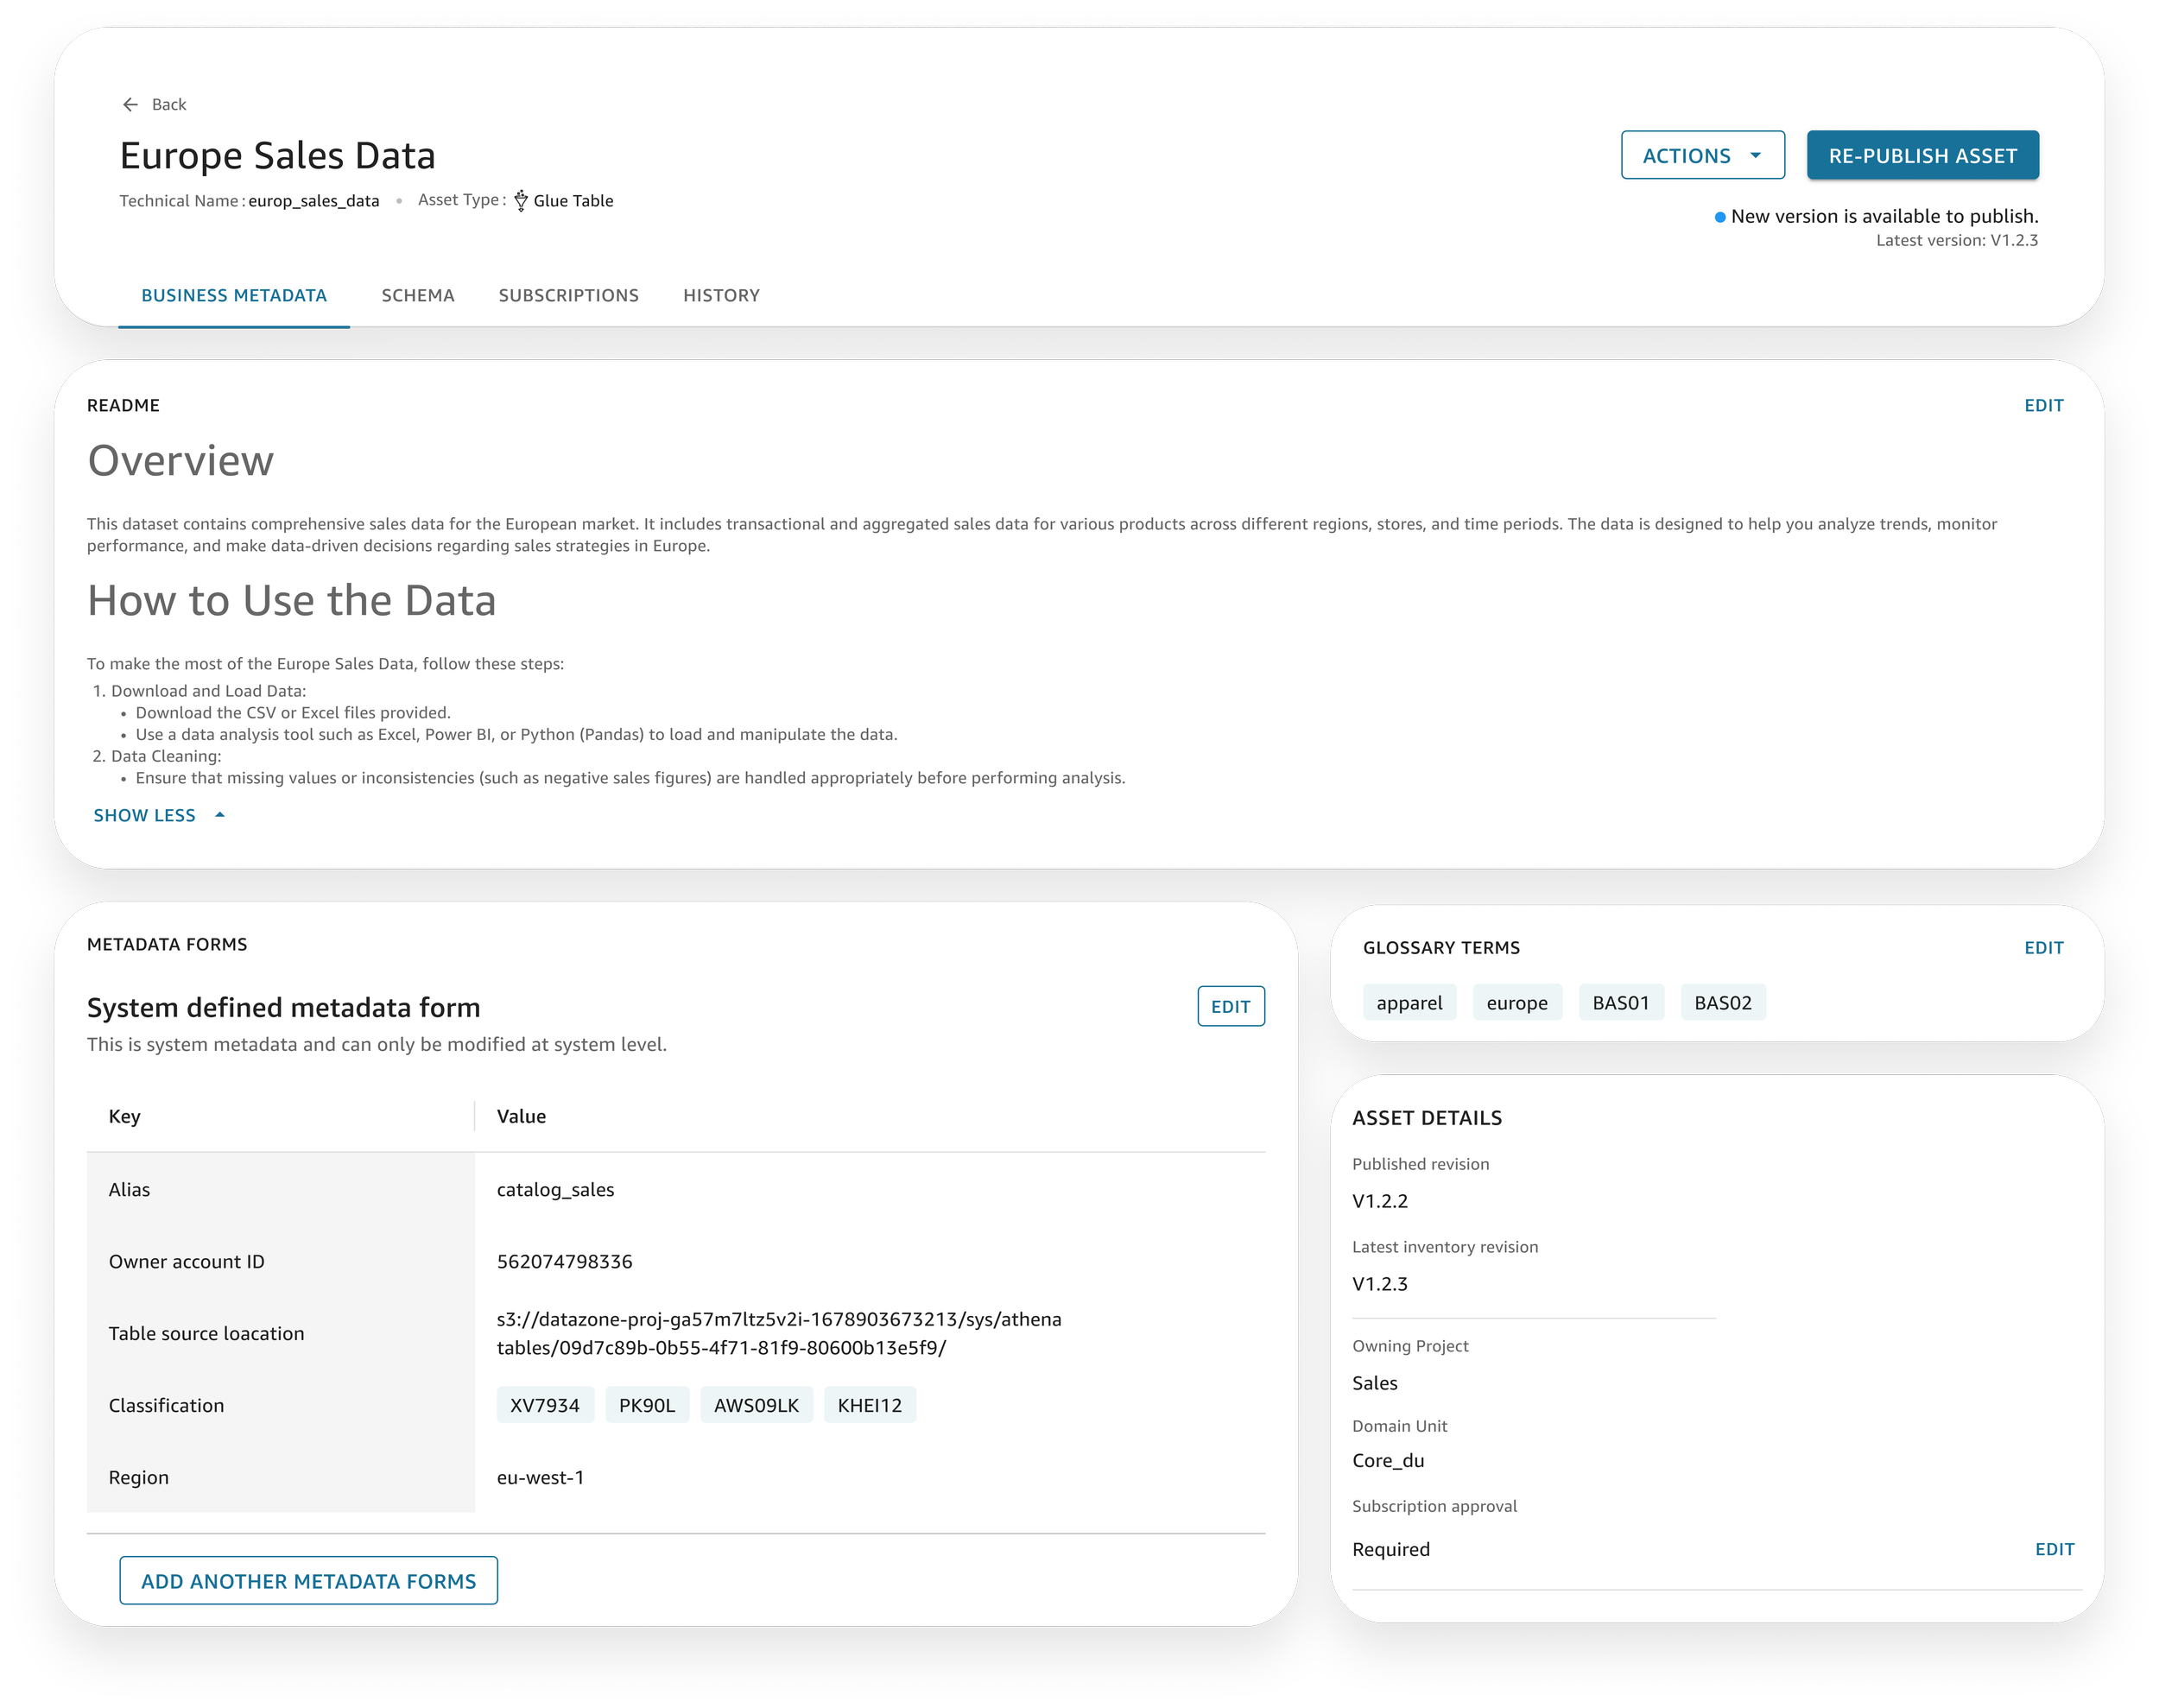
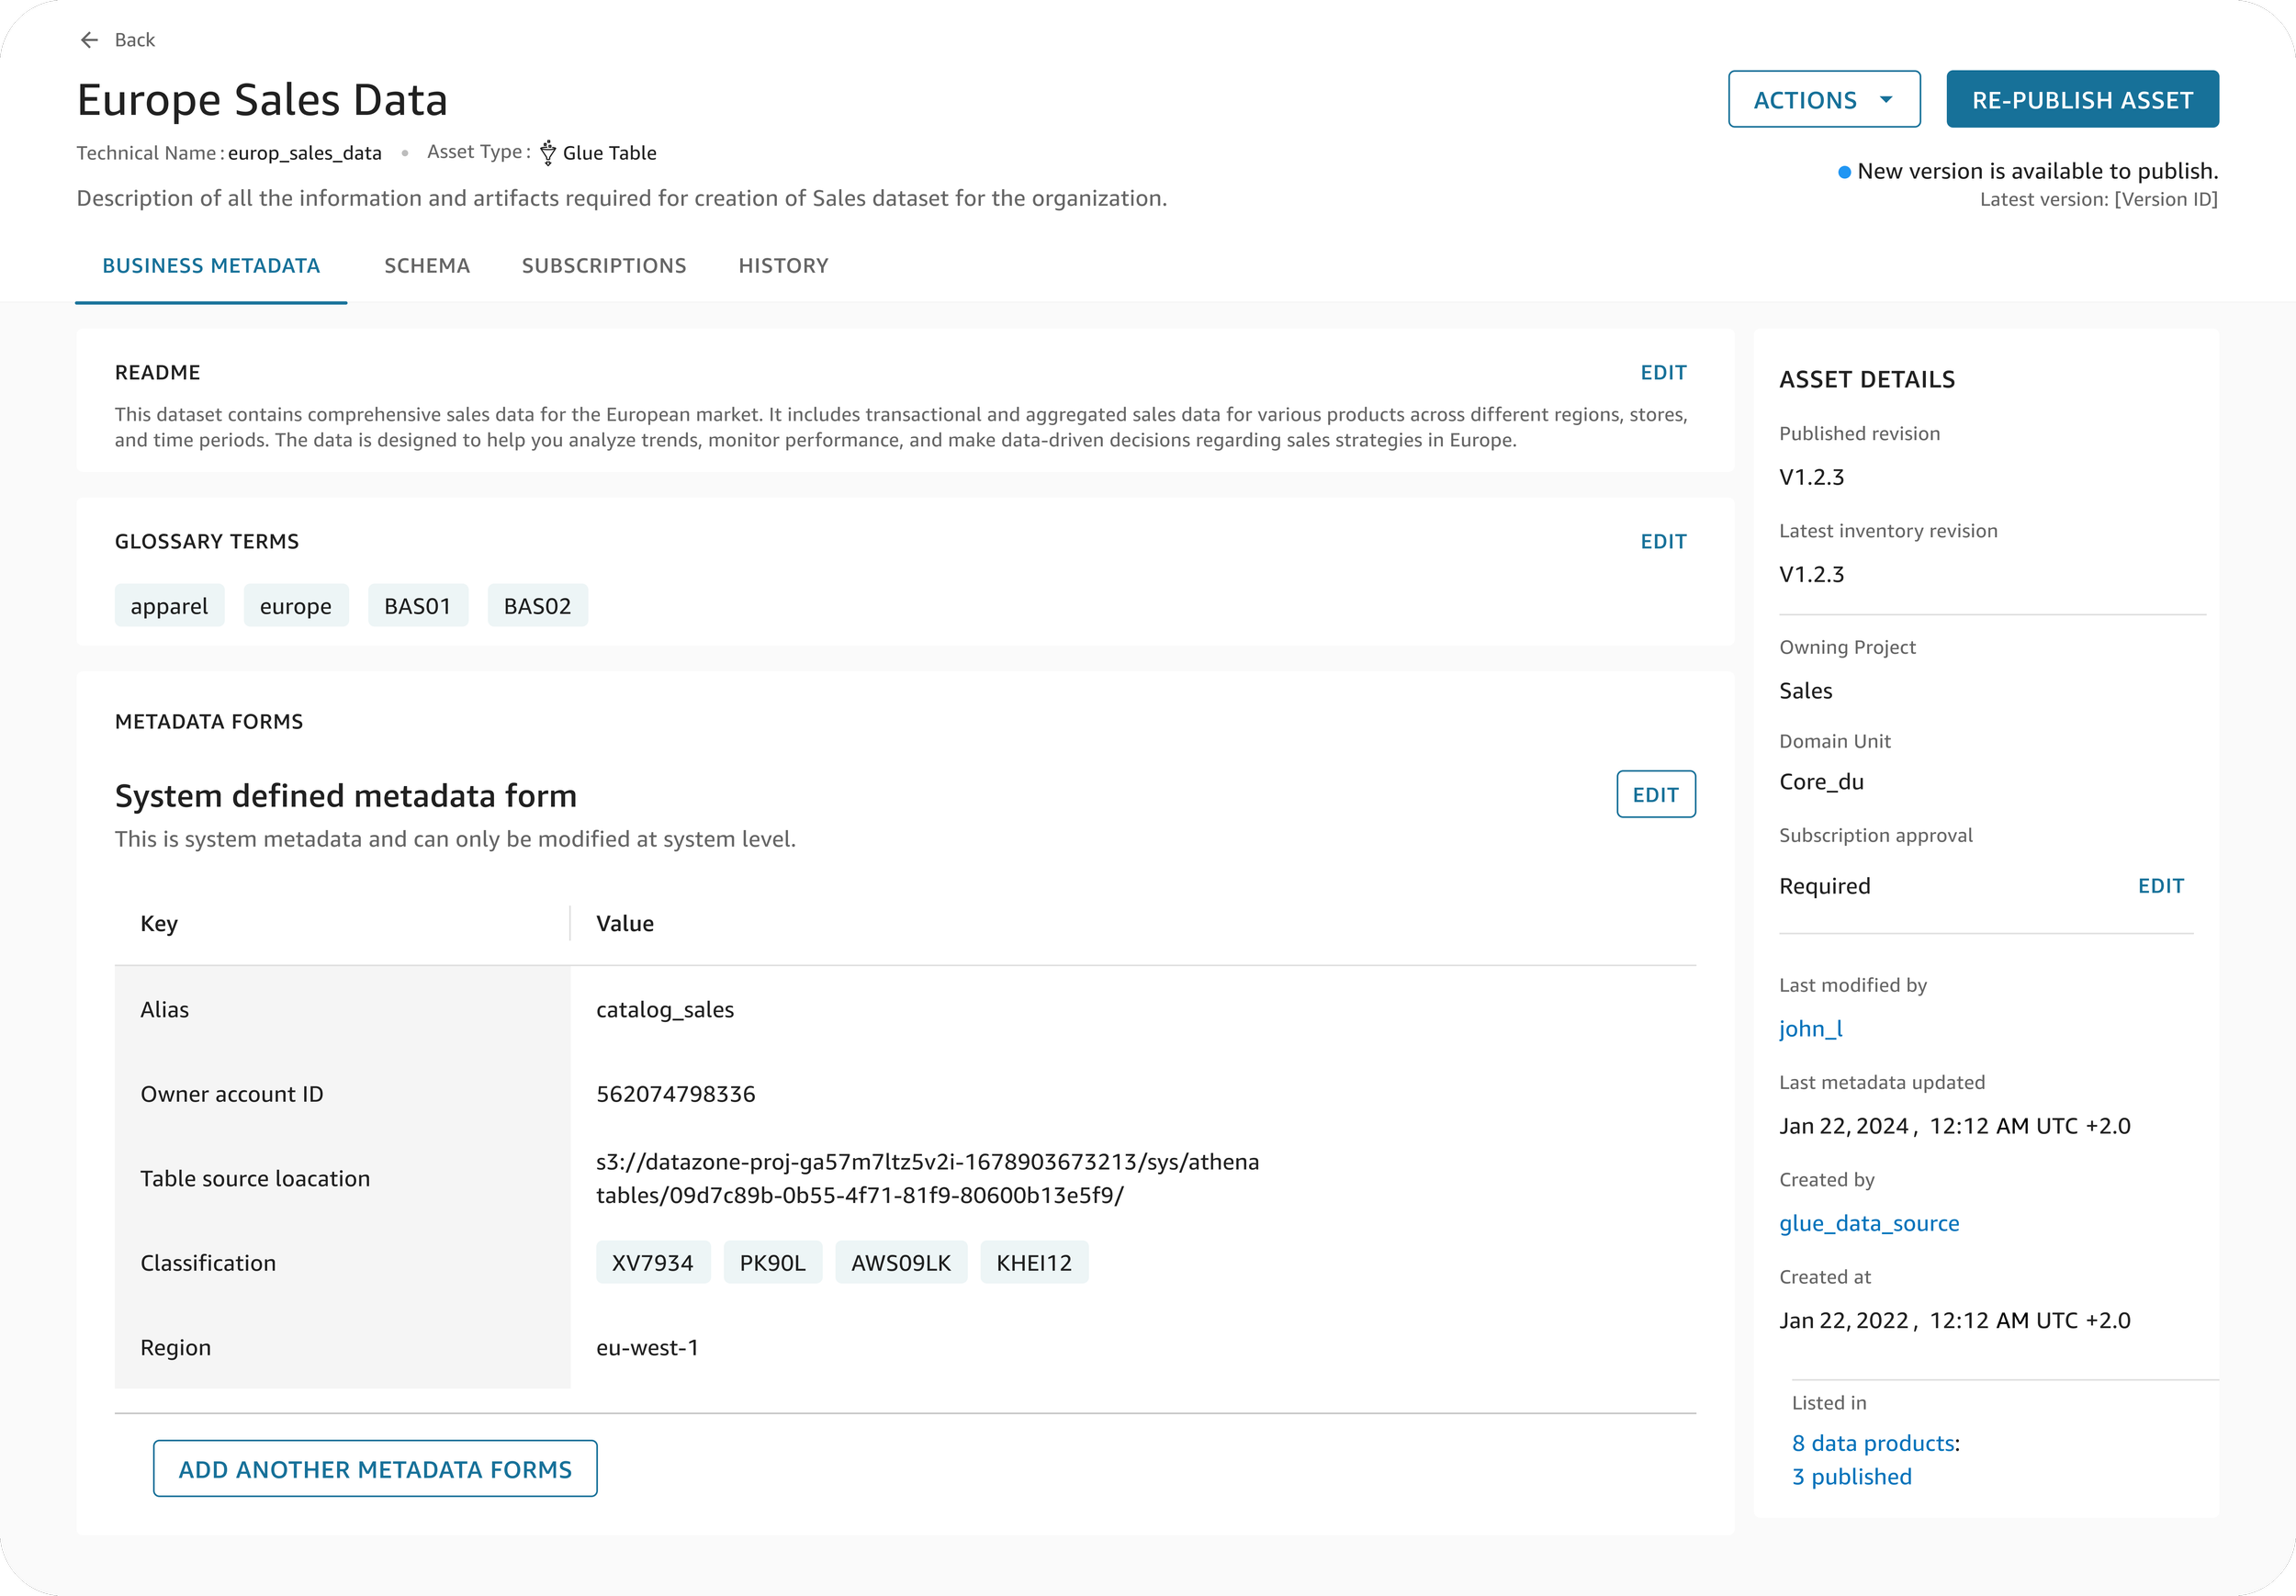
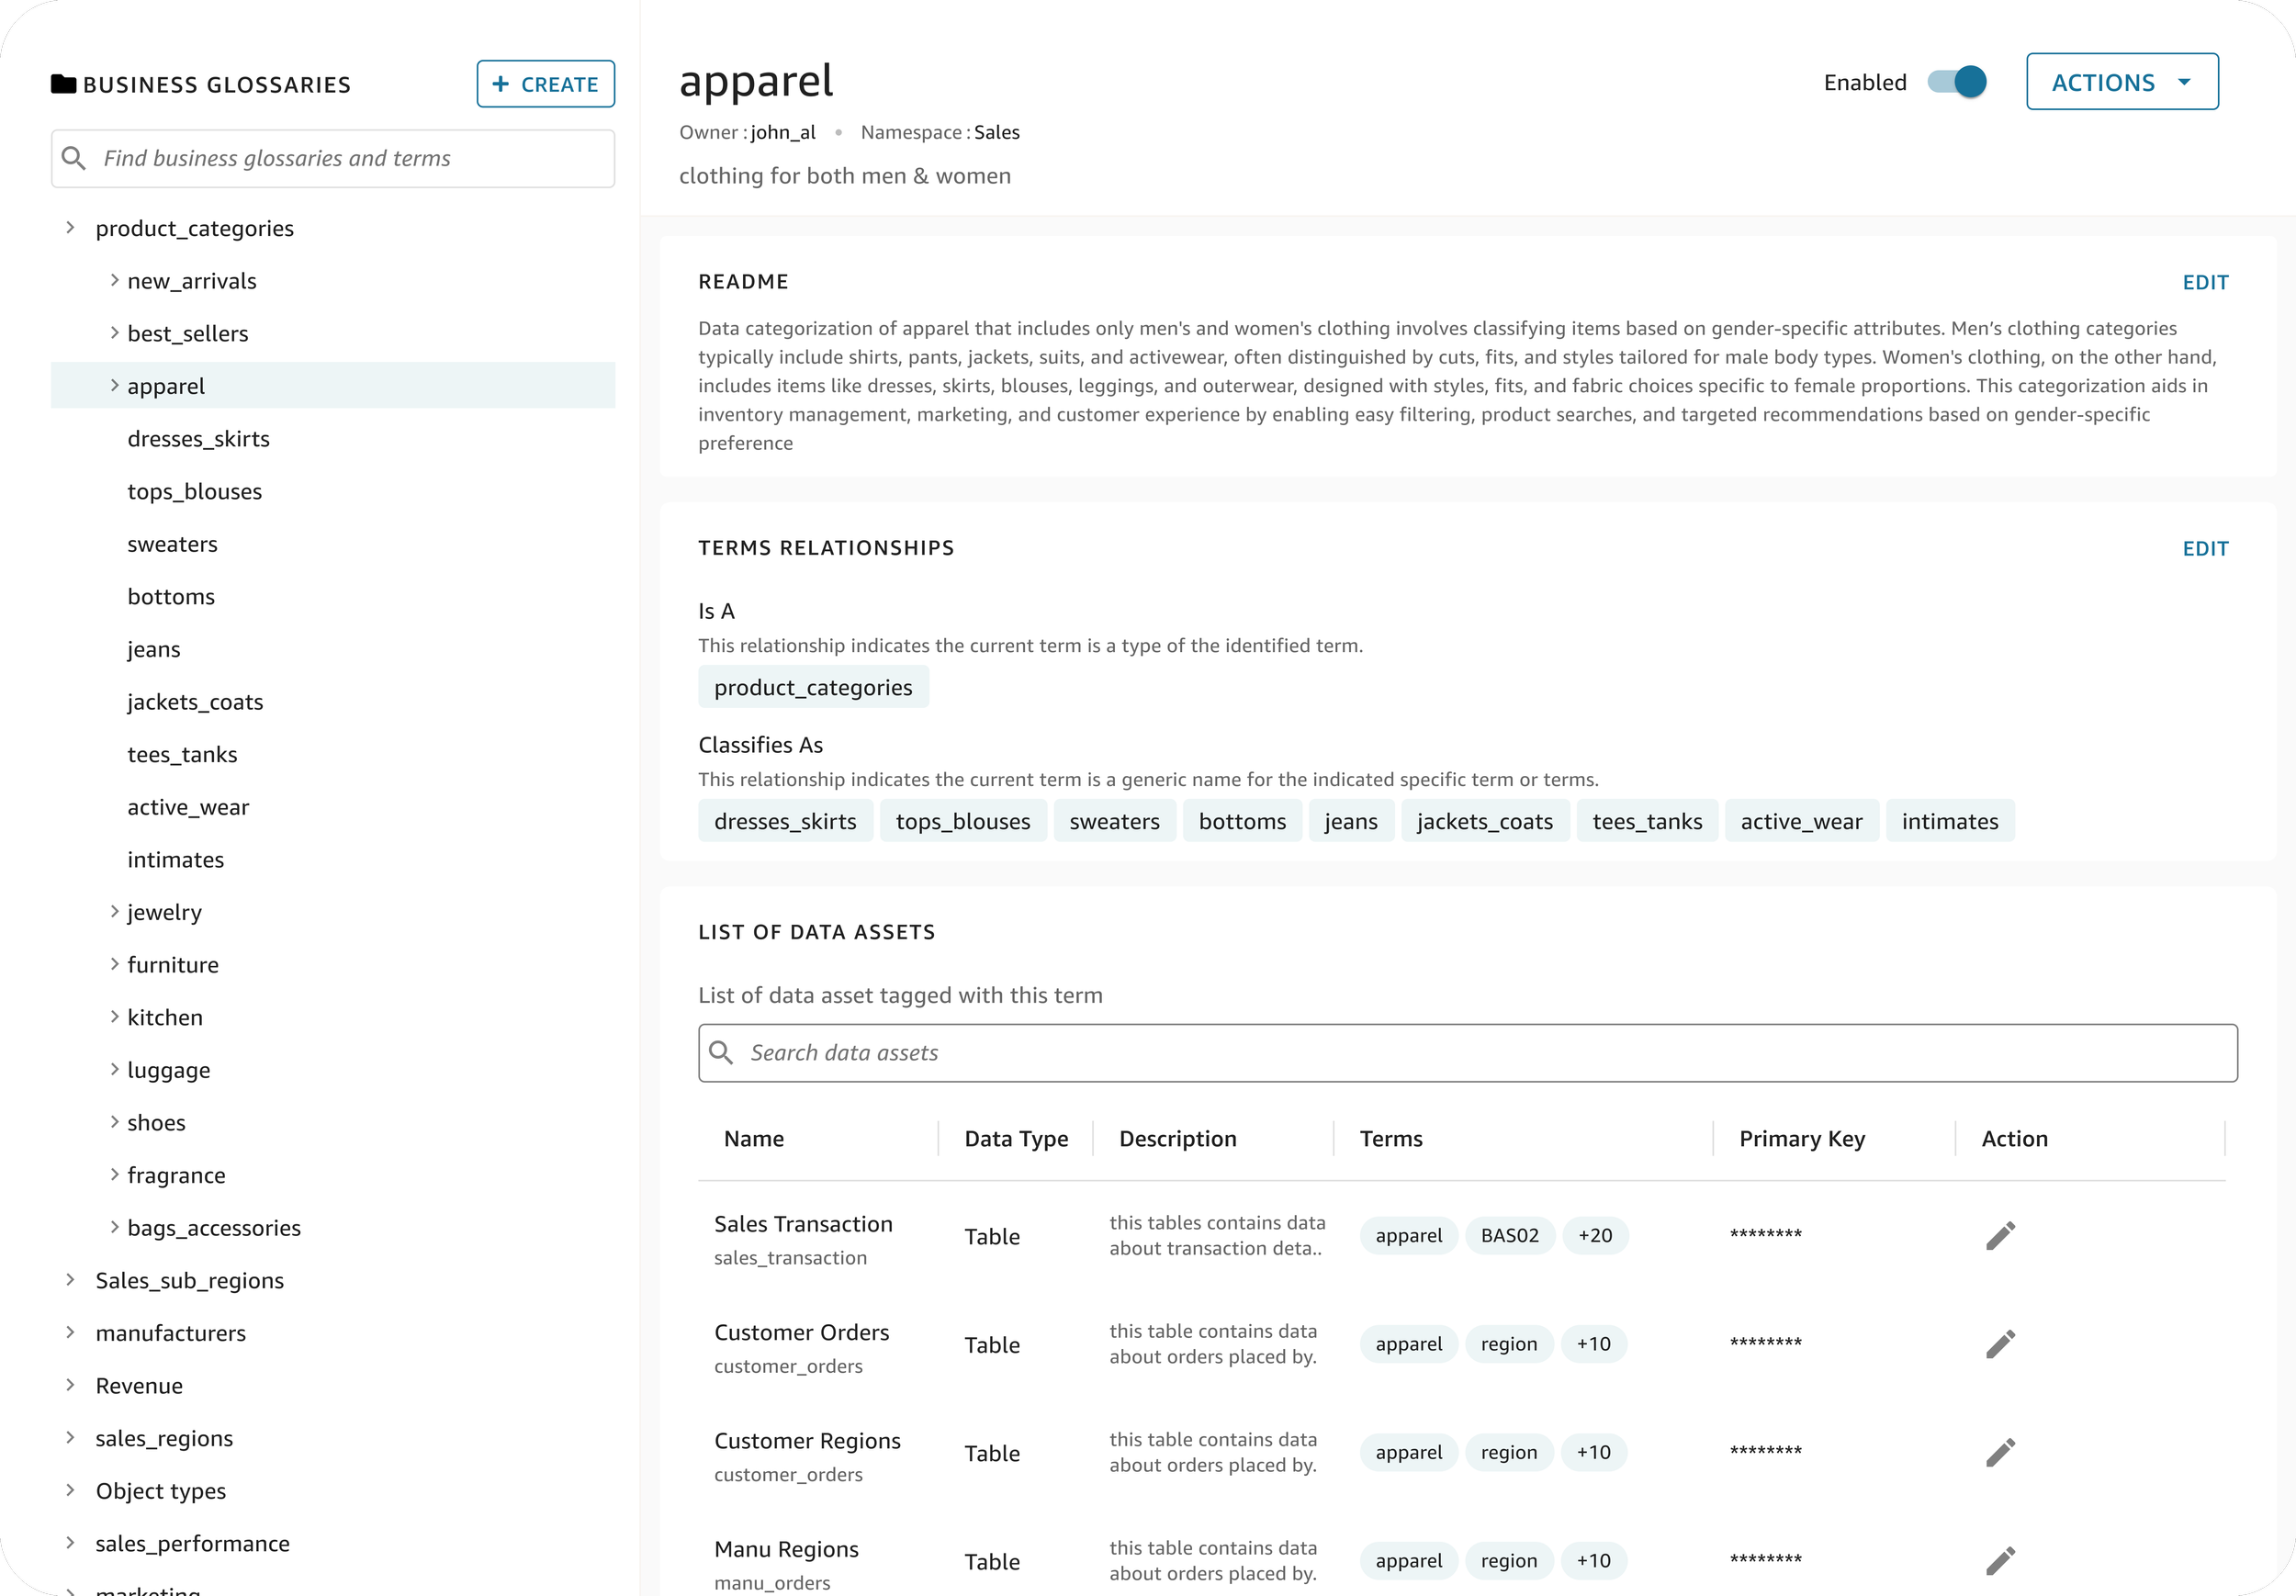
Data Governance
By applying metadata forms and glossary terms to assets, data producers can improve data discoverability.
-
Metadata Management
Templates & categorization that standardize the collection and management of metadata.
-
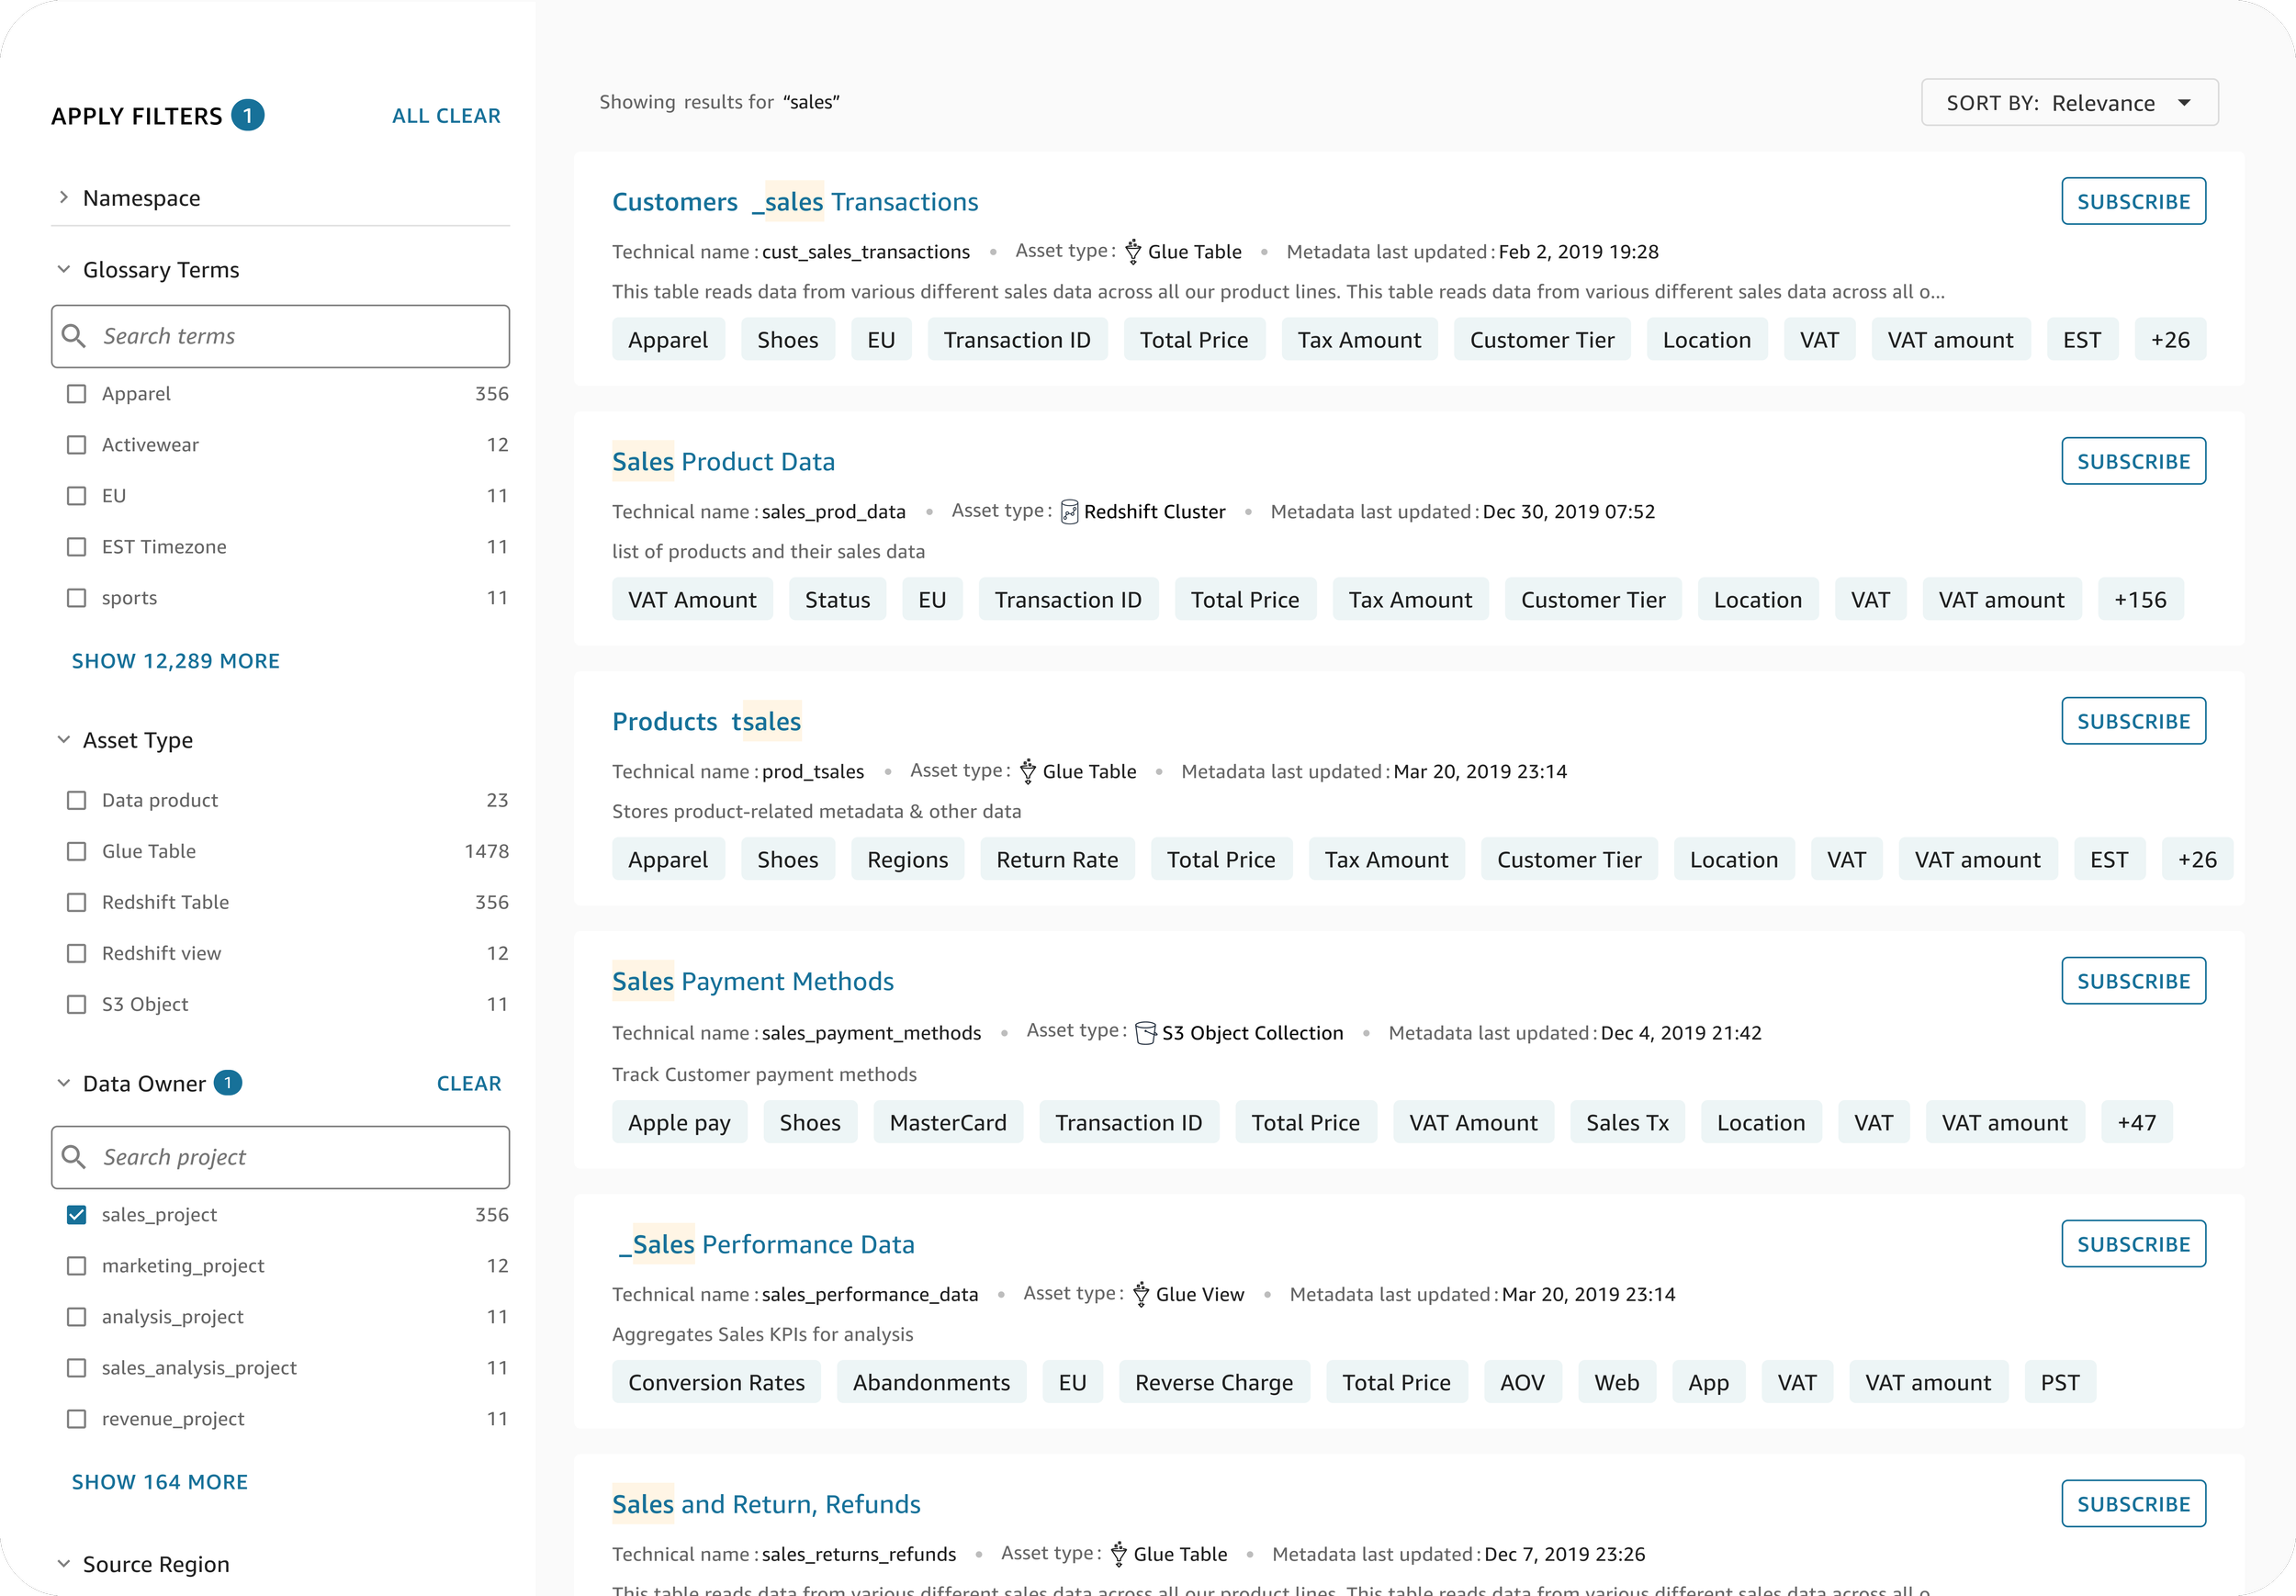
Data Discovery
Data consumers can easily find data assets by applying relevant filters,and view data asset details.
Timeline & Process

02/ Research & Analysis
Interviewing executives, Solutions Architects, and users gave me insights into the product vision, technical aspects, and user expectations. This research helped pinpoint the problems and key user pain points we need to solve.
Objective
1- Define the users
2- Identify their key pain points
3- User Journey with Datazone
Methodology

Shadowing
Spent time with users to understand their workflows to gain first hand experience of their pain points

User Interviews
Conducted 20+ in-depth user interviews to further understand their needs & requirements

Data from Solution Architects
Leveraged their direct client interactions to collect insights to identify key issues
Who are our users?

Data Producers / Stewards
Experienced in data management and governance, including both structured and unstructured data.
Pain Points
Data Silos and Fragmented Access
Businesses operate with data scattered across numerous independent databases. This necessitates accessing each database separately to retrieve and manage information.
Time-Consuming Processes
The need to connect to and query multiple disparate databases for analysis or reporting slows down critical business processes and decision-making.
Inefficient Data Management
Dealing with data in isolated systems leads to redundant efforts and a lack of a unified view. Routine data management tasks become cumbersome and require significantly more time and resources.
Scalability Challenges
As data volumes grow and the number of data sources increases, this fragmented approach becomes increasingly difficult and costly to maintain and scale effectively.

Data Producers / Stewards
Discover and access high-quality data to generate insights, then collaborate with colleagues to validate findings & share them, all with a less technical approach.
Time Spent on Data Search
Analysts waste valuable time navigating disparate systems and searching for the specific data they need for their analysis.
Difficulty in Data Discovery
Finding relevant data assets is a significant hurdle in large organizations with data spread across numerous departments.
Identifying Data Owners
Determining the correct data owners within the organization adds another layer of complexity and time to the data acquisition process.
Access Request Delays
The necessity of requesting and obtaining permission to access data from various owners introduces further delays in the analytics workflow.
03/ Design & Iterations
From the preview launch(limited users), I gathered crucial feedback, specifically focusing on usability, user expectations, IA and navigation. The learnings from this initial phase directly informed necessary refinements and optimizations to the user experience. This iterative approach, prioritizing user feedback early on, minimized risk and ultimately facilitated successful widespread adoption


High Level System Diagram
04/ Preview Launch
Datazone was preview-launched in November 2022 to internal users and select clients. Learnings & feedback from this preview was used to refine and improve the design ahead of the full launch in October 2023.


05/ Feedback & Learning
1. Observational Research (Shadowing)
To gain firsthand understanding of user behaviors and identify potential pain points within their natural environment.Shadowed data producers and consumers actively using the service.Observed their workflows for data governance, data discovery, and data utilization.
Following the preview launch, I spent three months collecting usability data to identify areas for improvement.
2. User Interview
To comprehensively understand customer needs, uncover areas for functional improvement, and gather qualitative feedback on their experiences.Shadowed data producers and consumers actively using the service.Conducted over 200 in-depth user interviews.
3. Collaboration with Solution Architects
To leverage their direct client interactions and insights to identify key issues and challenges faced by users in real-world scenarios.Collaborated with 10+ solution architects who were handling more than 50 clients.
Addressing the UX Issues
The preview launch surfaced significant usability and UX hurdles, revealing key discrepancies between our assumptions and actual user behavior. I categorized those issues in three categories.
1- Structural Misalignments
2- Expectation Gaps
3- System Complexity & User Support
High level UX issues identified during preview phase


06/ The Launch 🎉
After a year of multiple iterations, intense discussions and usability evaluations, the service was finally launched.


07 / MEASURING SUCCESS
1. Rapid Adoption
The service secured 7 new clients, bringing in over 140,000 active users of the catalog within the first month of its general launch.
2. Design-Driven Client Acquisition
The catalog's intuitive design directly led to securing a major client, who praised its ease of use for data quality control.
08/ Challenges
Complexity of the Service
Technical complexity of our service and how it connects with others in the vast world of AWS.
Lack of Competitive Products
We were the first one to launch something like this, so it was hard to find other competitor who were doing similar designs.
Unclear Vision
I was only given a one-page explanation, and I facilitated the initial sketching and definition of the service.
Limited Time and Resources
With limited time and resources for the preview launch, I had to collaborate closely with the tech team to ensure that my designs had a high impact while minimizing tech effort.